Make sense of every market move

Chartvane is charting and dashboard software for active investors and market analysts. Import price history or broker statements, or connect a market data feed, then build candlestick charts, mark your key levels and share clear dashboards in minutes.

  • Works in your browser, nothing to install
  • One-time payment, no subscription
  • Full refund within 14 days if it isn’t right for you
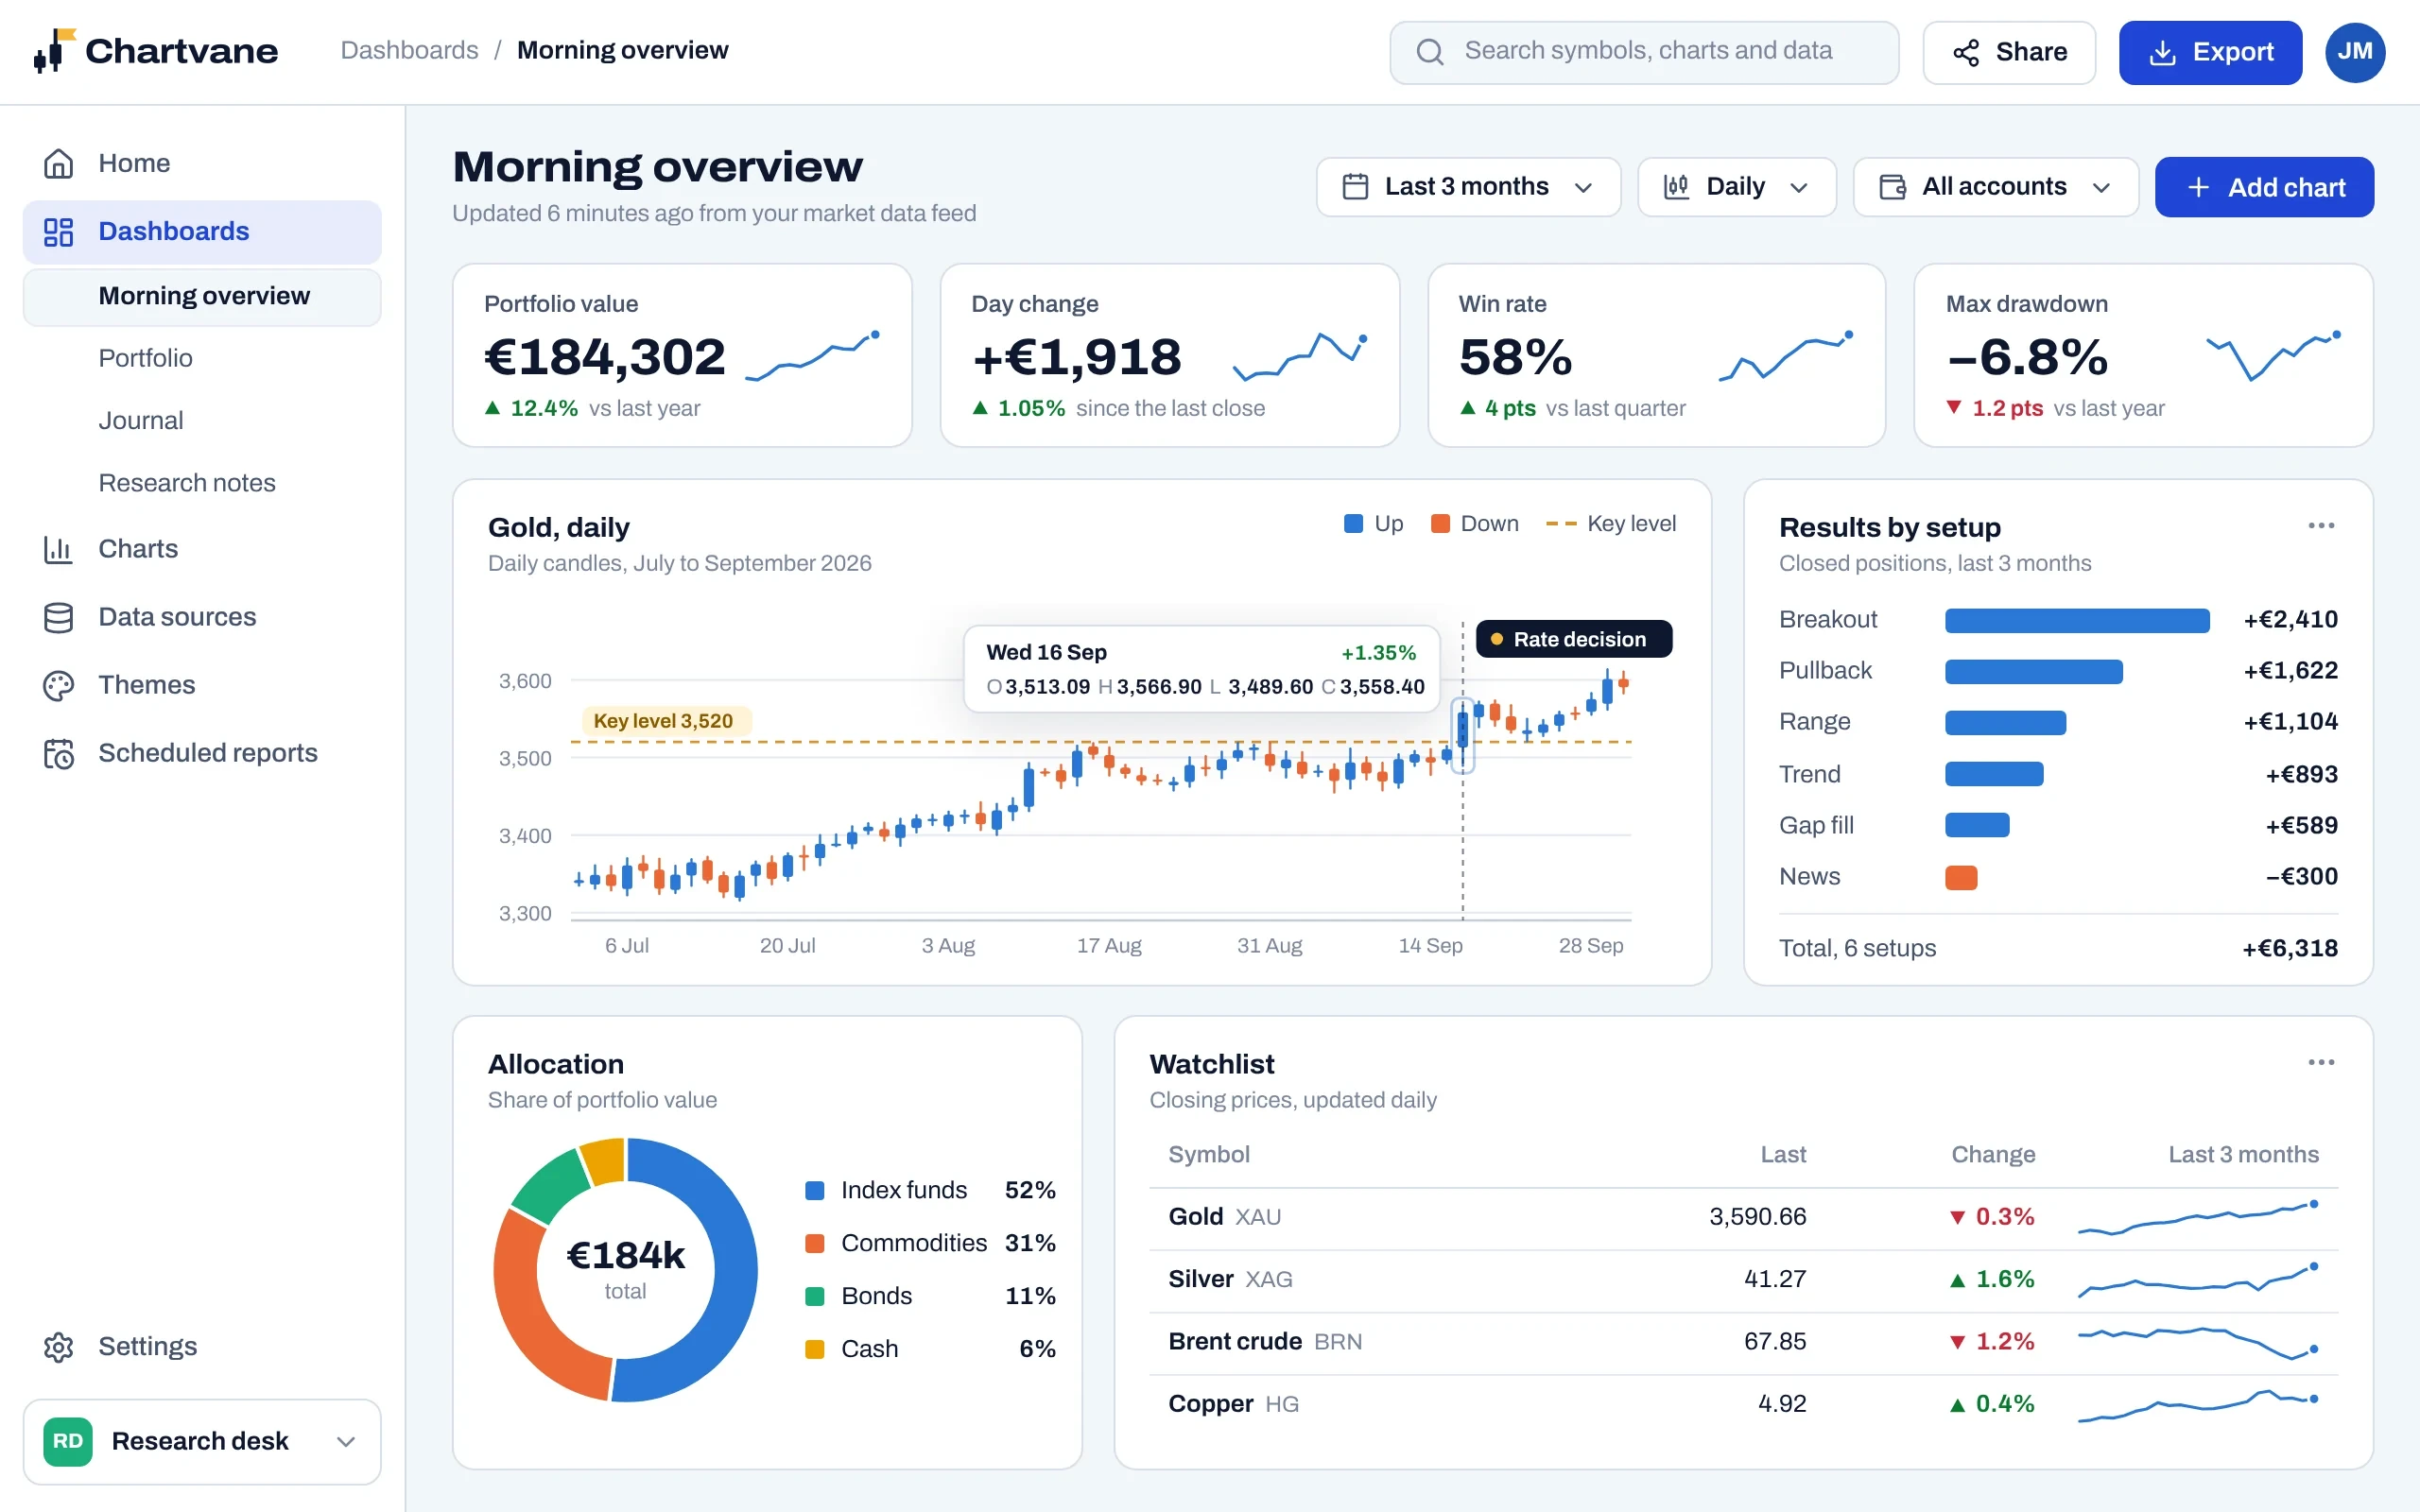
Chartvane dashboard showing a daily candlestick chart of gold with a marked price level and rate decision, portfolio value, day change, win rate and drawdown, results by setup, allocation by asset class and a watchlist
Chart type menu with candlestick, OHLC bar, line, area, column, donut, scatter, heatmap and treemap charts Export menu with PNG, SVG, PDF and CSV formats

Made for people who watch the markets every day

If your day starts with a price chart, a watchlist and a spreadsheet of positions, Chartvane brings them together and saves you rebuilding them every morning.

  • Active investors

    Positions, watchlists and results on one screen, instead of five browser tabs and a spreadsheet.

  • Technical analysts

    Candlesticks, key price levels and chart notes, laid out the way you read them.

  • Writers and commentators

    Branded, publication-ready charts for your morning note, newsletter or blog.

  • Investment clubs

    One shared watchlist, comments pinned to the chart, and no more screenshots in the group chat.

  • Finance educators

    Annotated chart examples for lectures, workshops and coursework.

  • Funds and family offices

    Performance, exposure and risk reports, with roles, single sign-on and an audit log.

From raw prices to a finished dashboard

Everything happens in one place, so the chart you share is always drawn from your latest prices and positions.

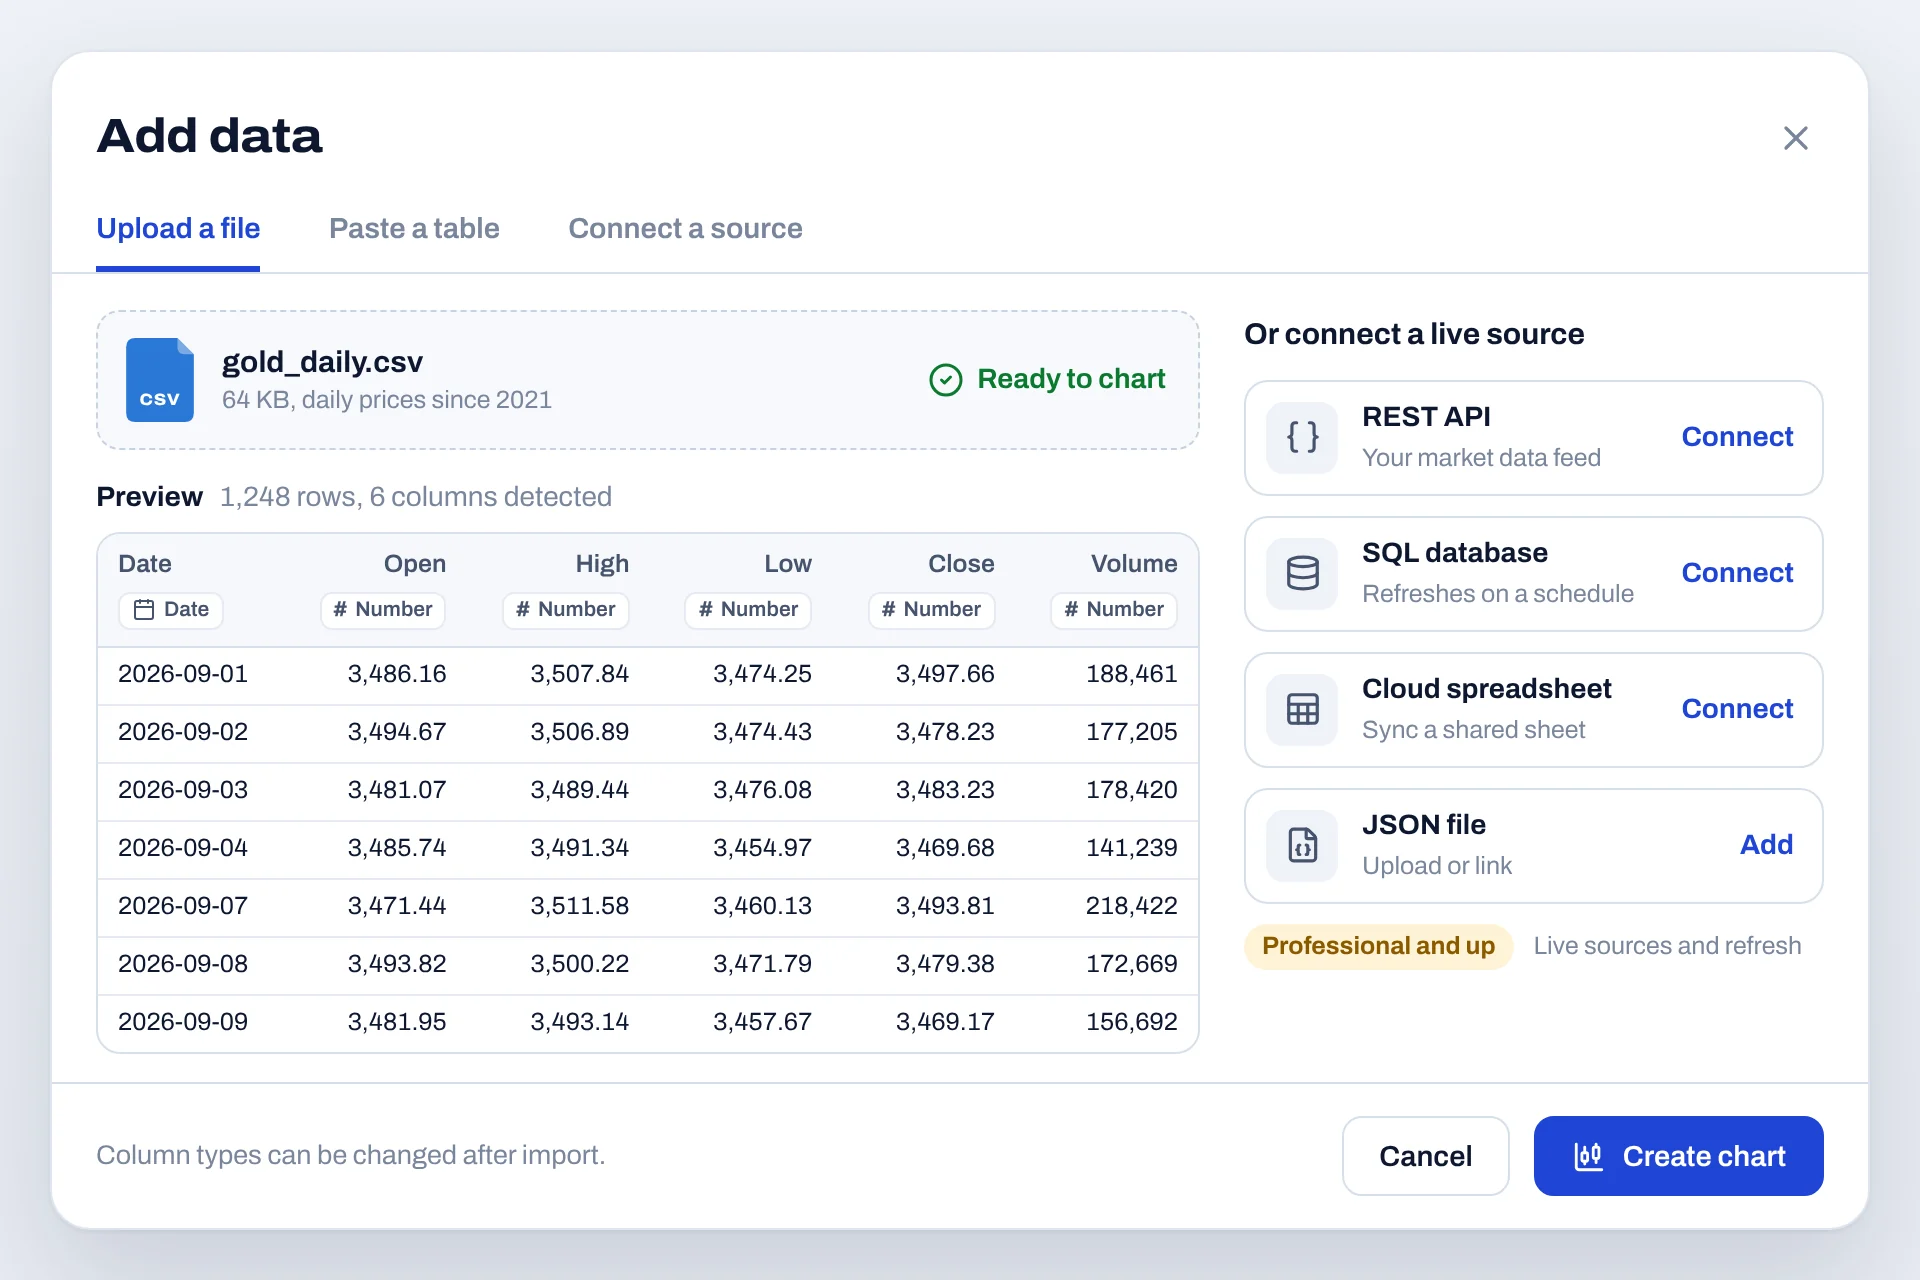
Add data window with an uploaded CSV of daily prices, a preview table with detected date, open, high, low, close and volume columns, and buttons to connect a REST API, SQL database, cloud spreadsheet or JSON file
Import

Bring in prices and positions from anywhere

Upload price history or statements exported from your broker as CSV, XLSX or JSON, paste a table straight from a spreadsheet, or connect a market data API or your own SQL database. Chartvane recognises dates, prices and symbols, so your columns are ready to chart.

  • Files up to 100 MB, enough for years of minute-by-minute prices
  • Dates, prices and volumes detected automatically, and easy to change
  • Live market data refreshes on a schedule (Professional and above)
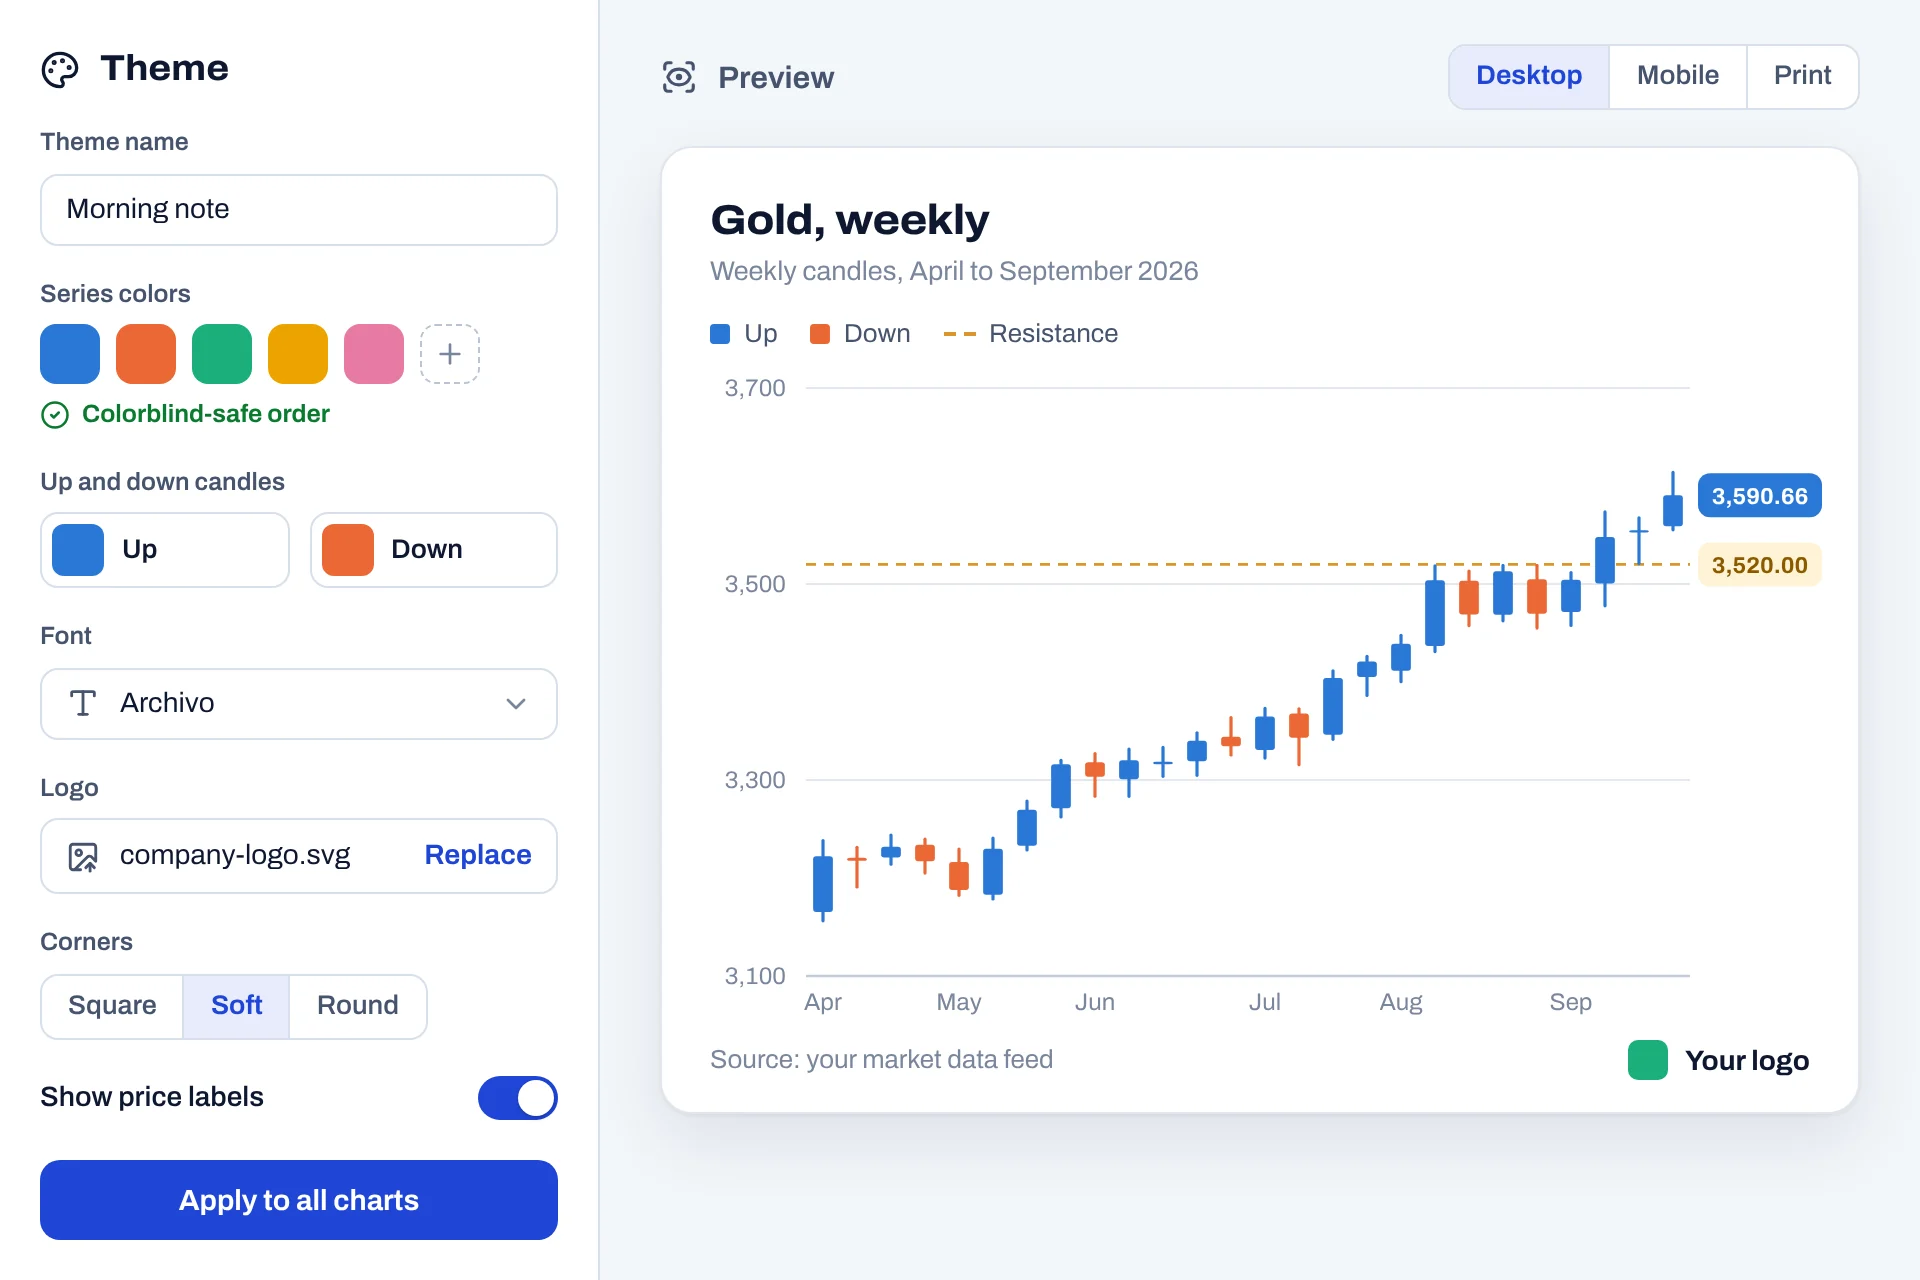
Theme editor with series colors, up and down candle colors, font, logo and corner settings, next to a weekly candlestick chart with a marked price level using those settings
Design

Charts that look the way you read them

Save your colors, fonts and logo as a theme and every chart follows it. Pick your own up and down candle colors, use the built-in colorblind-safe palettes, and mark support, resistance and entry levels with reference lines and notes on any chart.

  • Themes apply to every chart and dashboard at once
  • Up and down colors that colorblind readers can tell apart
  • Reference lines and notes to mark the levels that matter
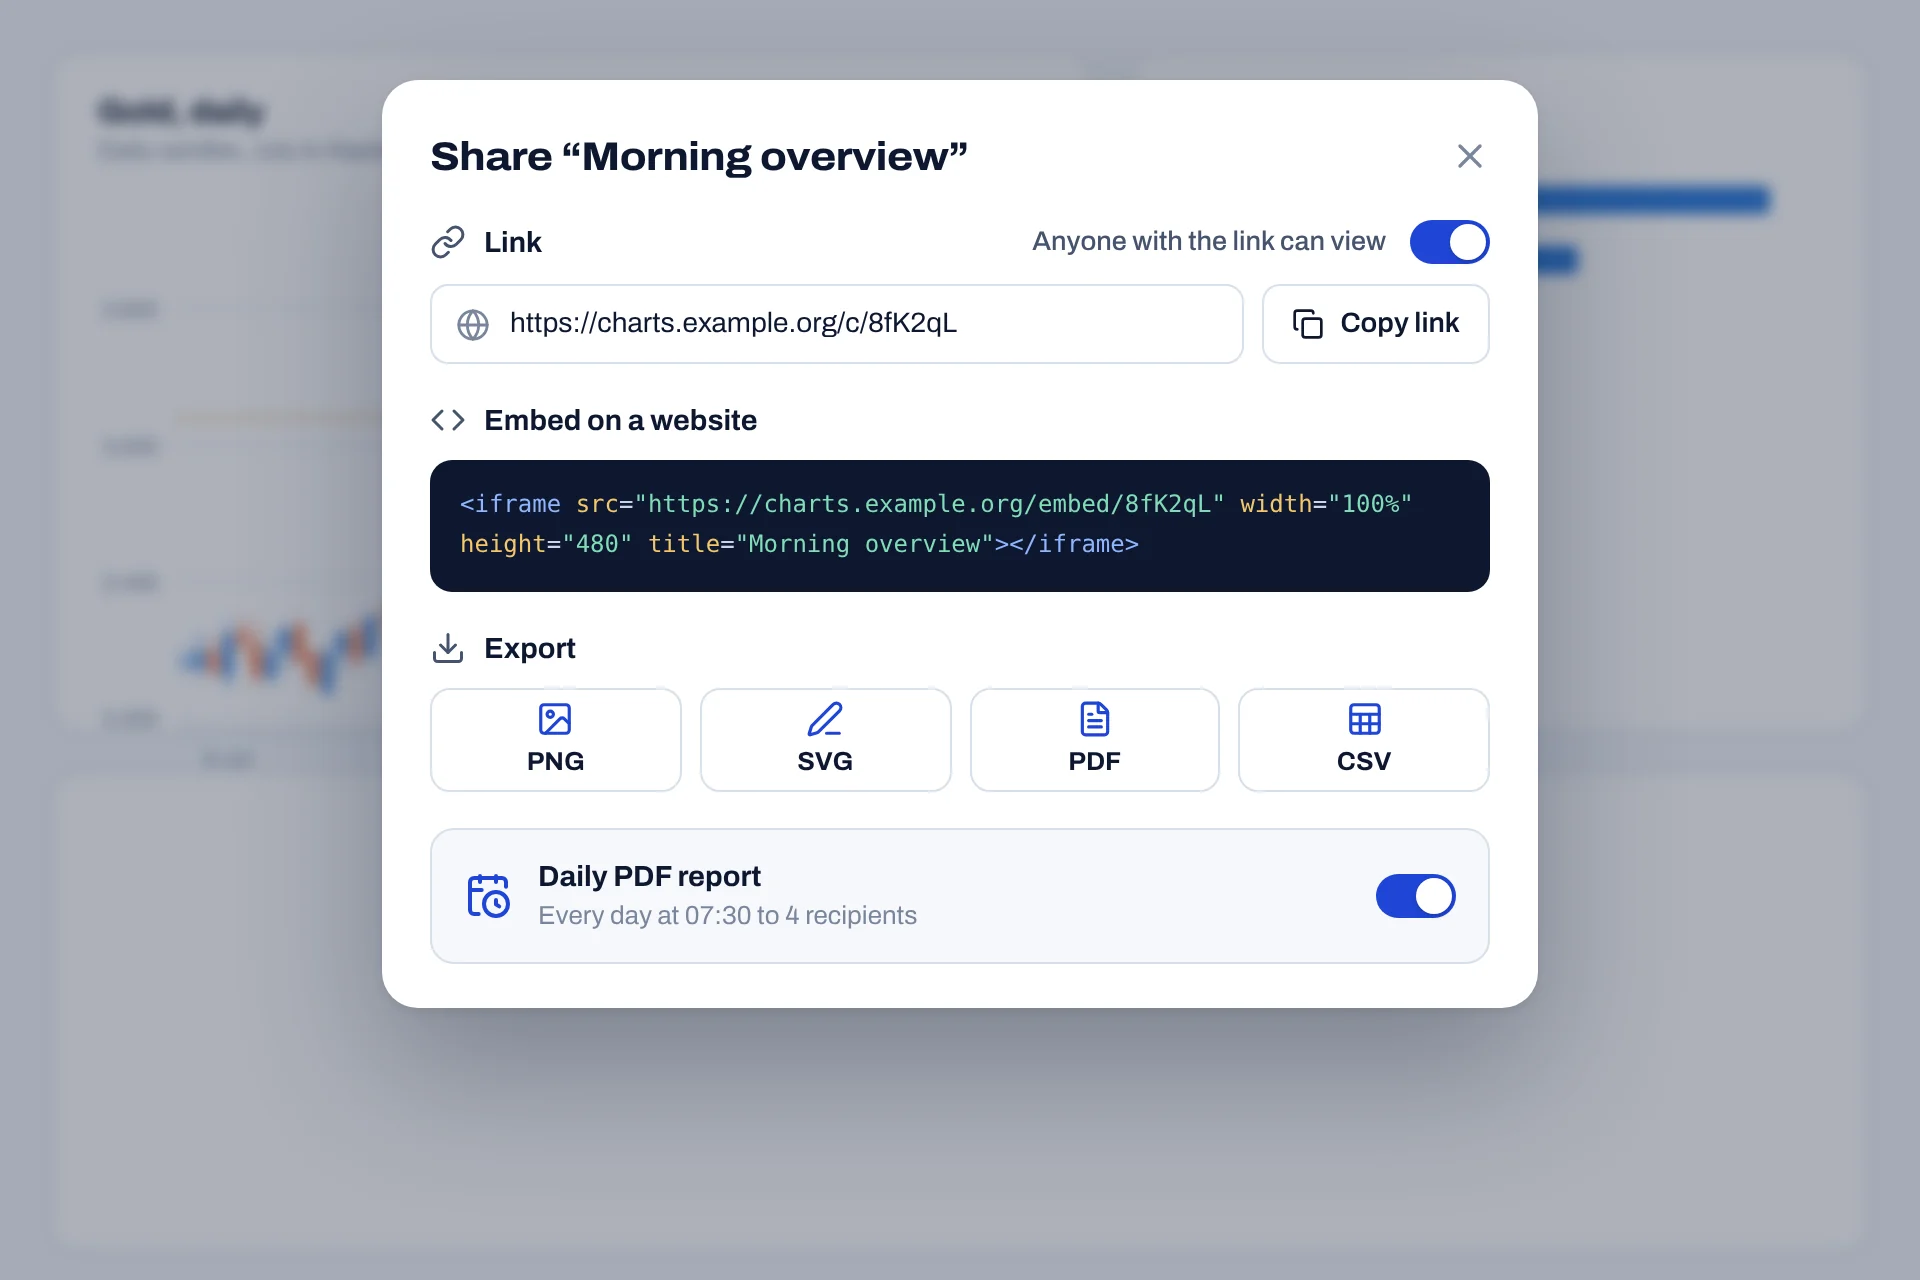
Share window with a view-only link, website embed code, PNG, SVG, PDF and CSV export buttons, and a daily PDF report scheduled for 07:30
Share

Share, embed and export

Send a view-only link, embed a live chart on your blog or newsletter site, or export to PNG, SVG, PDF and CSV. Schedule a PDF of any dashboard and have it waiting in your inbox before the market opens.

  • Embeds update when your data does
  • High-resolution exports for notes, posts and slides
  • Unlimited viewers on every package
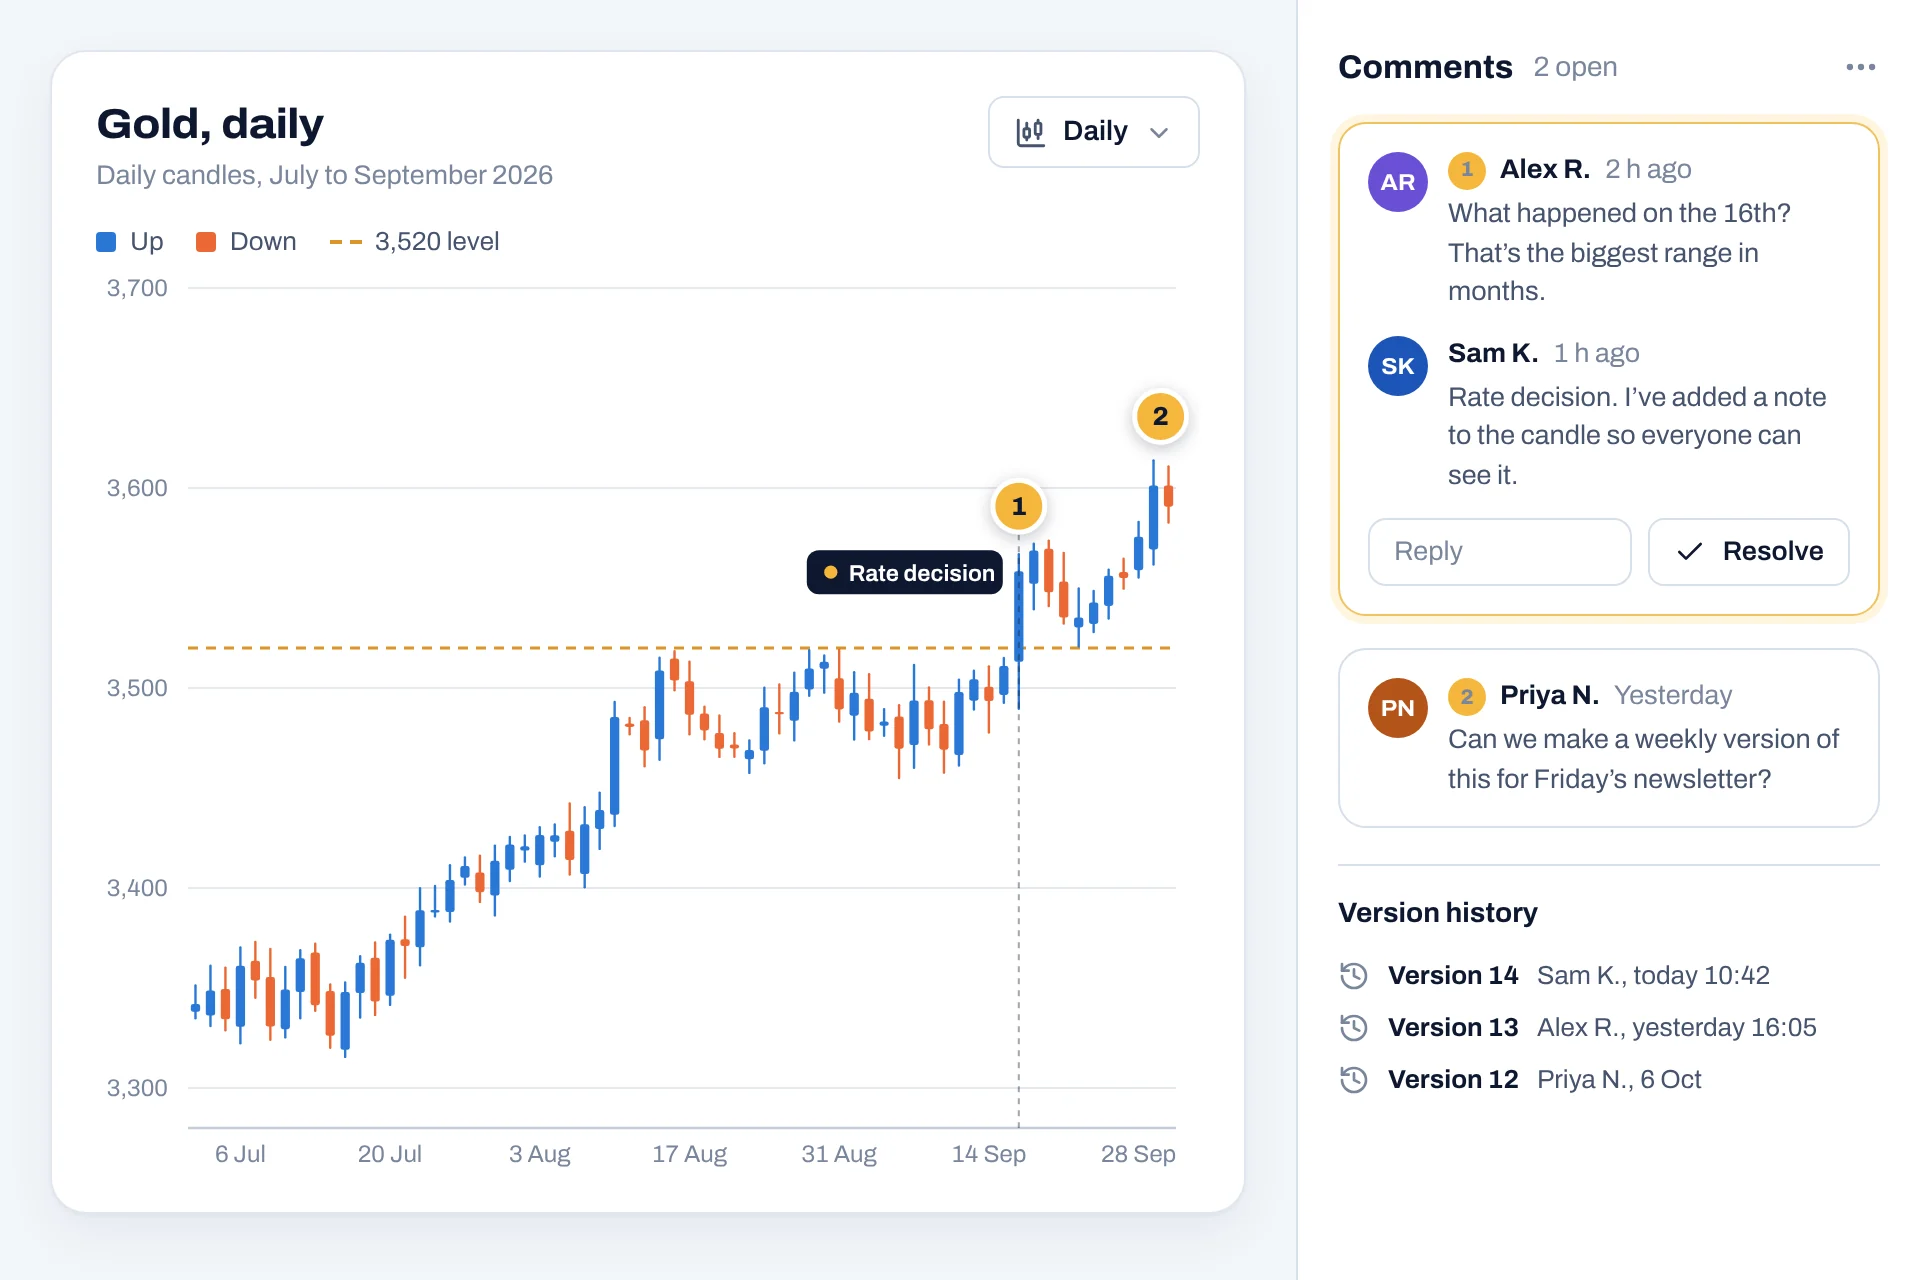
Daily candlestick chart with numbered comment pins, a note marking a rate decision, a comment thread between colleagues and a version history list
Review

Review it together

Pin a comment to the exact candle you’re discussing, mention a colleague, and resolve the thread once you agree. Version history keeps every change, so you can see who moved a level and restore an earlier version.

  • Comments pinned to the exact point on a chart
  • Full version history with one-click restore
  • Viewer, editor and admin roles for each workspace

More features

  • Interactive filters

    Date ranges, symbol and account dropdowns, and drill-down that update every chart on a dashboard.

    All packages
  • Accessible by default

    Keyboard navigation, data tables for screen readers and readable contrast.

    All packages
  • Scheduled reports

    PDF snapshots of any dashboard by email, daily, weekly or monthly, so your recap is ready before the open.

    Team and Business
  • Version history

    See every change and restore any earlier version of a chart or dashboard.

    Team and Business
  • Roles and permissions

    Control who can view, edit and manage each workspace and folder.

    Team and Business
  • API access

    Create and update charts from your own scripts, models and internal tools.

    Team and Business

40+ chart types, each with a clear job

Pick a chart by what you want to see. These eight cover most of what you’ll look at on a normal market day.

  • Candlestick

    Open, high, low and close for each period, such as daily or hourly prices.

  • Line

    Change over time, such as closing prices, or your portfolio against a benchmark.

  • Column

    Comparing amounts, such as volume per day or results by month.

  • Stacked area

    How each holding adds up to your portfolio’s value over time.

  • Donut

    Allocation across holdings or asset classes, best with five parts or fewer.

  • Scatter

    How two measures relate, such as risk and return across your holdings.

  • Heatmap

    Patterns across two dimensions, such as average volume by weekday and hour.

  • Treemap

    Nested categories sized by value, such as holdings grouped by sector.

Three steps from price data to dashboard

You don’t need a developer or any code to get from a price file to a dashboard you can share.

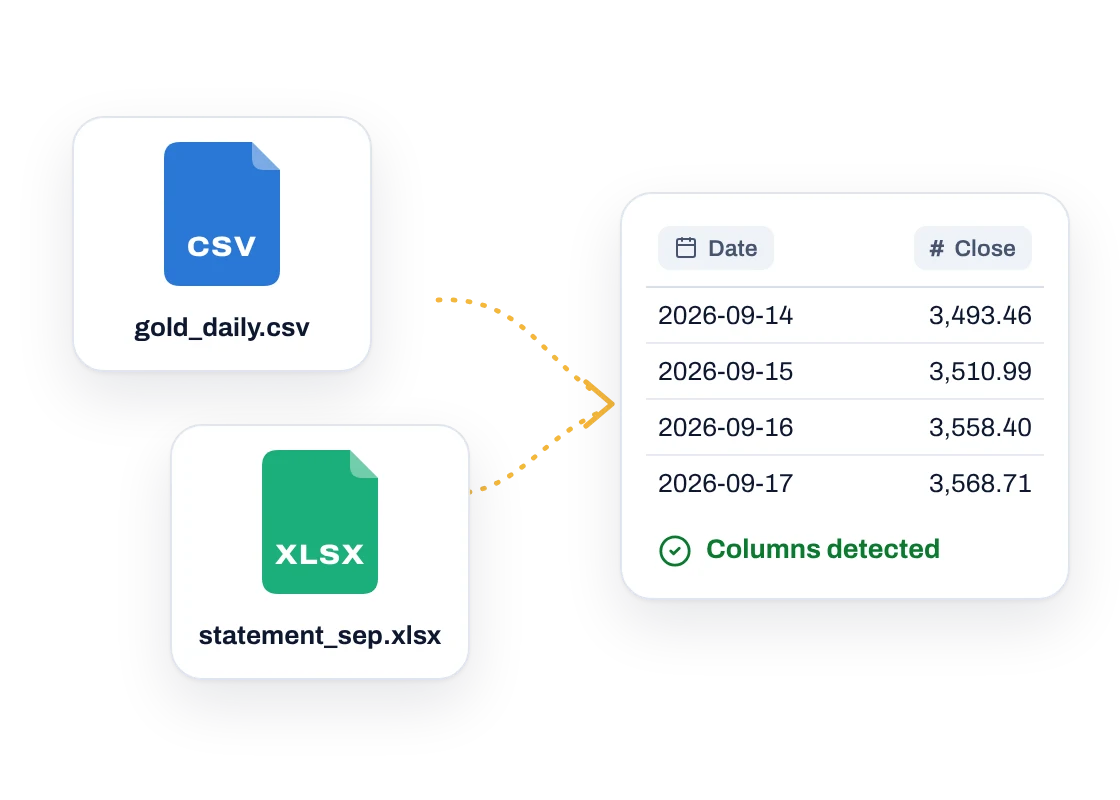
  1. A CSV of daily prices and an XLSX account statement being imported into a table with detected date and price columns
    1

    Import your data

    Upload price history or a broker statement, paste a table or connect a live feed. Chartvane checks the columns for you.

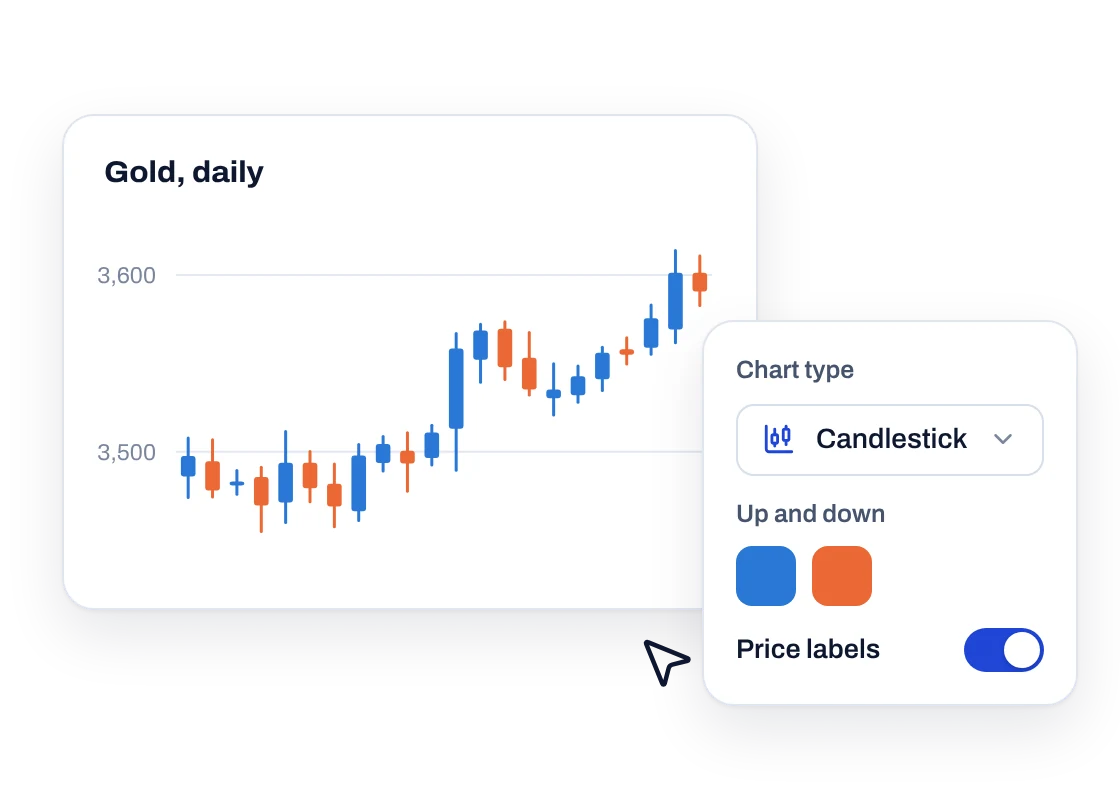
  2. A daily candlestick chart with a style panel for chart type, up and down colors and price labels
    2

    Build your charts

    Choose a chart type, drag your open, high, low and close columns onto it and mark your levels. Arrange charts into a dashboard.

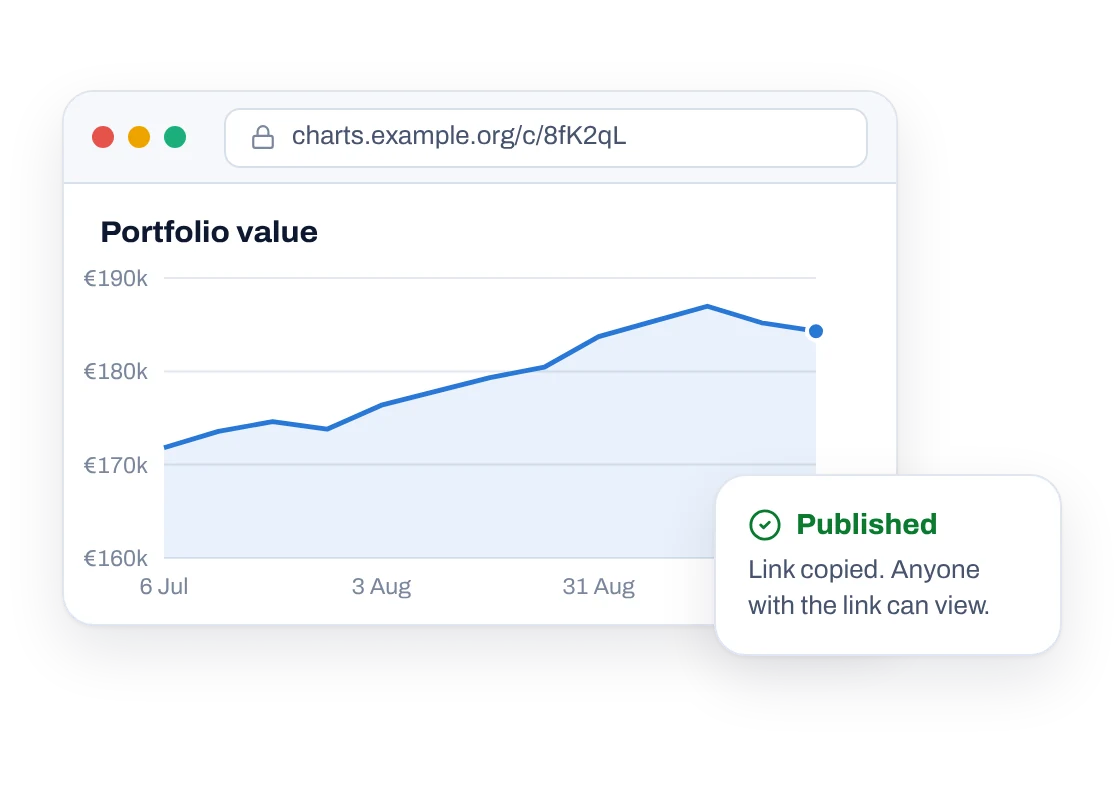
  3. A published portfolio value chart in a browser window with a confirmation that the share link was copied
    3

    Share the result

    Publish with one click, then send the link, embed it in your newsletter or schedule a PDF for the morning.

Packages

Four packages, each paid once. There’s no subscription and no monthly fee: you keep your package for as long as Chartvane is available, with all updates included.

Starter

2 editor seats
€199.90one-time payment

For individual investors and small teams building their first market dashboards.

  • 25 dashboards
  • All 40+ chart types, including candlesticks
  • CSV, XLSX and JSON import
  • PNG, SVG and PDF export
  • View-only share links
  • Email support within 2 business days
Choose Starter

Team

10 editor seats
€499.10one-time payment

For research teams and investment clubs that build and review charts together.

  • Everything in Professional, plus:
  • Shared workspaces and folders
  • Comments and version history
  • Roles and permissions
  • Scheduled PDF reports
  • API access
  • Priority email and chat support
Choose Team

Business

25 editor seats
€999.90one-time payment

For funds, family offices and larger firms with security, scale and support needs.

  • Everything in Team, plus:
  • Single sign-on (SAML)
  • Audit log
  • Data refresh every 15 minutes
  • Custom domain for shared dashboards
  • Onboarding session for your team
  • Dedicated account manager
Choose Business
  • Prices are in euros and paid once at checkout. Any VAT or sales tax is shown before you pay.
  • No subscription and no renewals. Your card is charged once, and only again if you choose to upgrade.
  • Not the right fit? Ask within 14 days of paying for a full refund. See our Refund Policy.

Your numbers stay yours

We only use the prices, positions and statements you upload to draw your charts. You can export them or delete them whenever you like.

  • Encrypted

    Data is encrypted in transit and at rest.

  • Yours to take with you

    Export charts and source data at any time, in open formats.

  • GDPR-ready

    A data processing agreement is available to every customer. Read our Privacy Policy.

  • Access control

    Roles on Team, plus single sign-on and an audit log on Business.

Questions

What is Chartvane?

Chartvane is web-based software for turning price data into charts, dashboards and reports. You import price history or a broker statement, or connect a market data feed, choose a chart type, mark the levels that matter and share the result with your team, your readers or nobody at all.

Does Chartvane give investment advice or place orders?

No. Chartvane is a charting and analysis tool. It doesn’t recommend what to buy or sell, it can’t place orders, and it never holds your money. Prices can fall as well as rise, and any decision you make using your charts is your own.

Where does the market data come from?

From you. Chartvane charts the data you bring: price history and statements you upload, or a market data feed you already use, connected on Professional and above. Some data providers limit how their prices can be shared, so check their terms before you publish or embed charts that use them.

Do I need to install anything?

No. Chartvane runs in any up-to-date version of Chrome, Edge, Firefox or Safari on Windows, macOS and Linux. Dashboards you share can be viewed on phones and tablets too.

How does payment work?

Each package is a one-time payment in euros, made by card at checkout. There is no subscription and nothing renews automatically, so you are only charged once. We email an invoice after your payment, and you can download it again from your account settings.

How long can I use my package?

For as long as Chartvane is available. Your one-time payment includes all product updates for the package you bought, and you never have to pay again to keep using it.

Can I upgrade later?

Yes. You can move to a larger package at any time and pay only the difference between the price you paid and the price of the new package. The upgrade starts straight away.

What is your refund policy?

If Chartvane isn’t right for you, ask within 14 days of your payment and we’ll refund it in full. The full details are in our Refund Policy.

Who owns the data I upload?

You do. We process your prices, positions and statements only to provide the service to you, and you can export or delete them at any time. Our Privacy Policy explains how we handle personal data.

Which file types can I import?

CSV, TSV, XLSX and JSON files up to 100 MB, such as price history or statements exported from your broker, or a table pasted from a spreadsheet. On Professional and above you can also connect REST APIs and SQL databases, such as a market data feed, and refresh them on a schedule.

How do I get help?

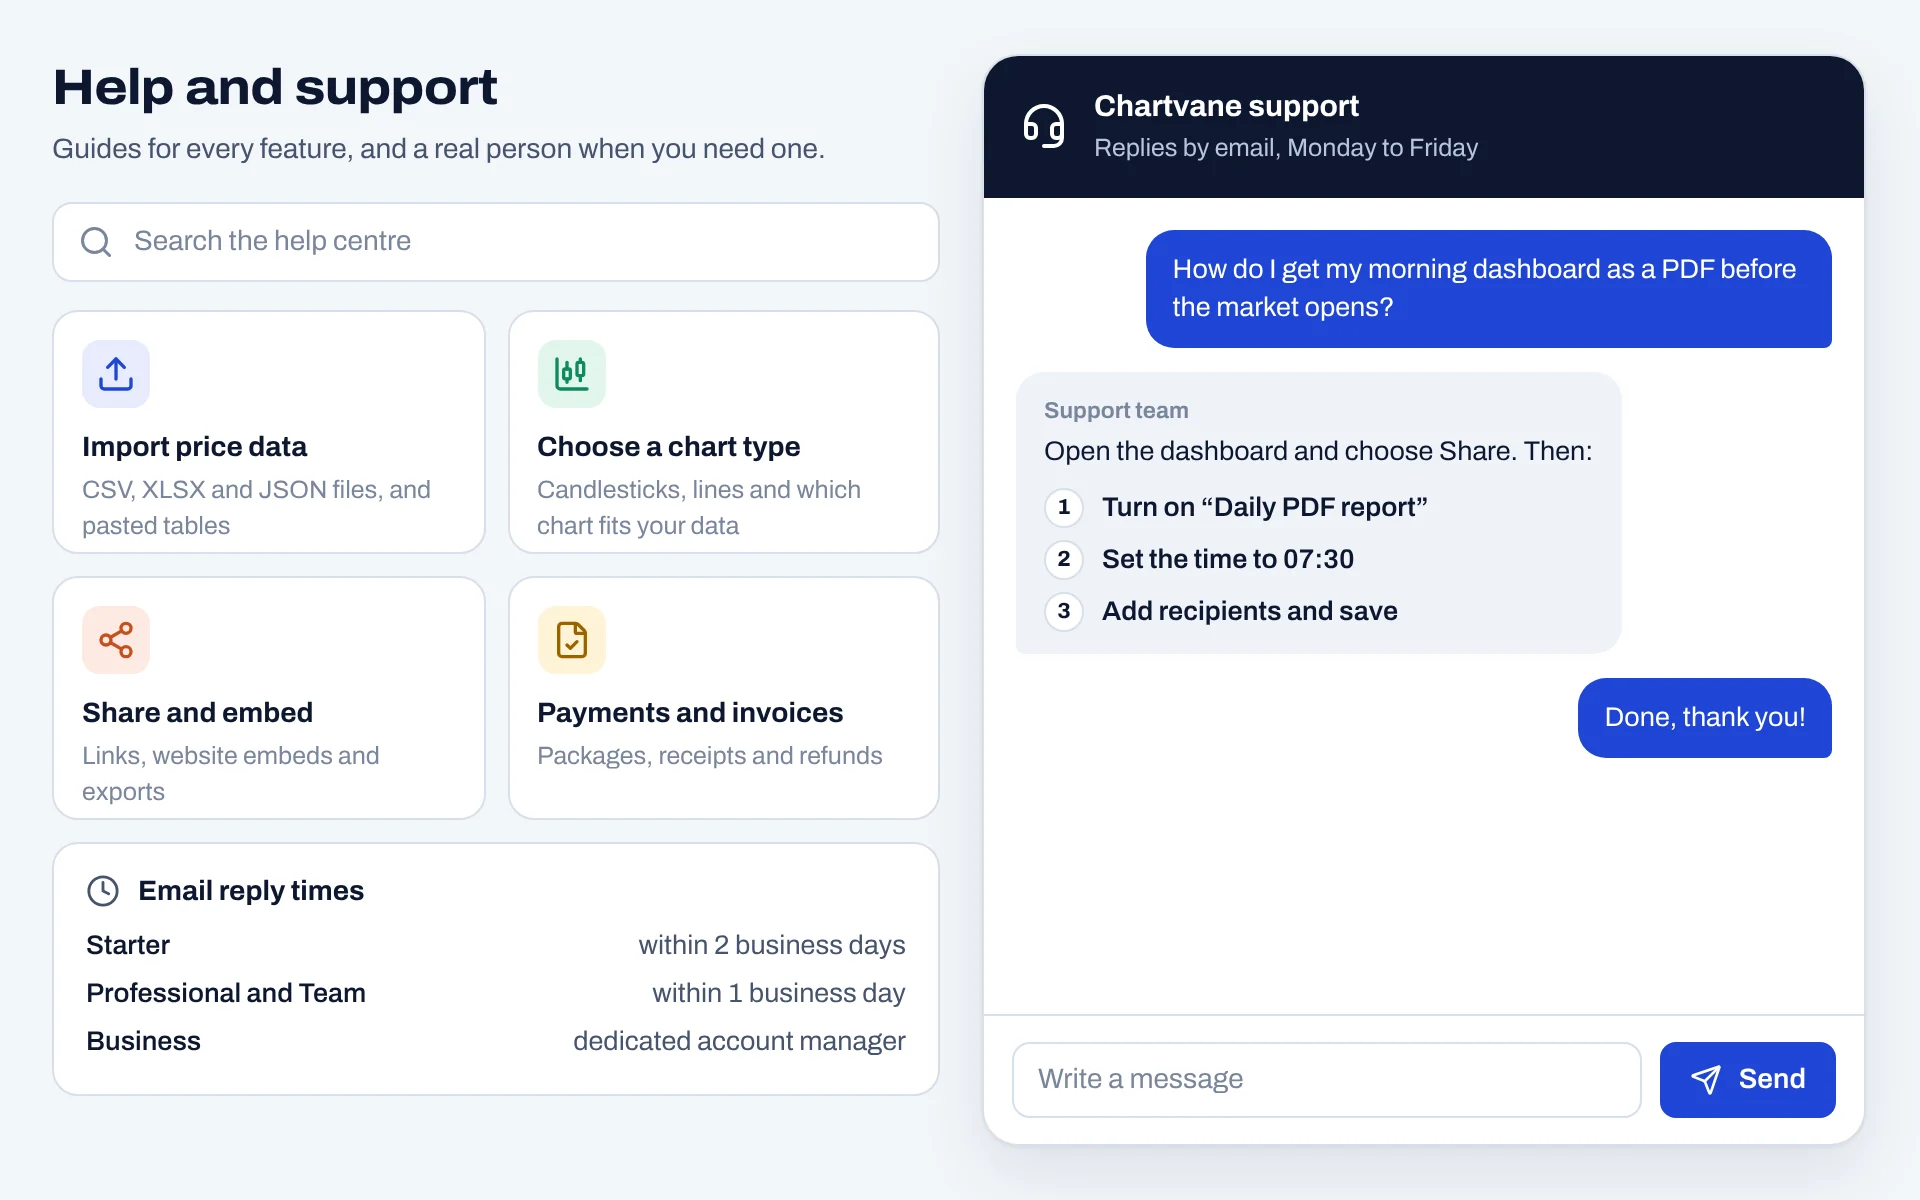
Email us at [support@yourcompany.com]. We reply within 2 business days on Starter, within 1 business day on Professional and Team, and Business customers have a dedicated account manager.

About us

Chartvane is developed and operated by [Company Name] Ltd, a software development company registered in England and Wales. We build charting tools for people who follow the markets closely, so that a chart answers a question instead of adding to the noise.

We sell our software directly to individuals, teams and firms, with a single one-time payment for each package.

Company name
[Company Name] Ltd
Company number
[company number]
Registered office
[registered office address]
VAT number
[VAT number, if registered]
Email
[support@yourcompany.com]
Phone
[phone number]
Chartvane help centre with guides for importing price data, choosing a chart, sharing, and payments and invoices, next to a support conversation
Email [support@yourcompany.com]
Phone [phone number]
Support hours Monday to Friday, 9:00 to 17:30 UK time
Postal address [registered office address]